Bjelakovic G, Gluud LL, Nikolova D, Whitfield K, Wetterslev J, Simonetti RG, et al. Vitamin D supplementation for prevention of mortality in adults. Cochrane Database of Systematic Reviews. 2014, 1, s. CD007470.
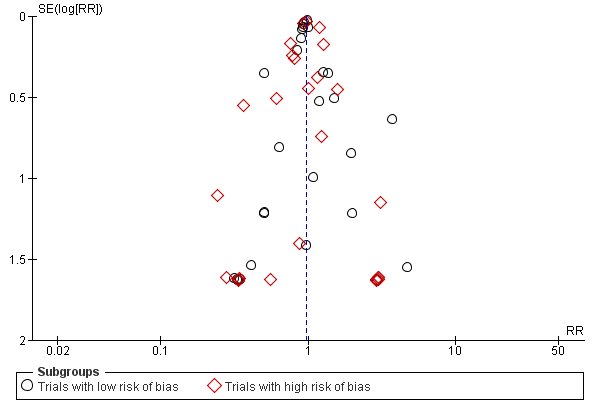
Figure w7 (Analysis 1.1): Funnel plot of comparison 1.1 Vitamin D versus placebo/no intervention. Outcome: 1.1 All-cause mortality in trials with a low or high risk of bias.
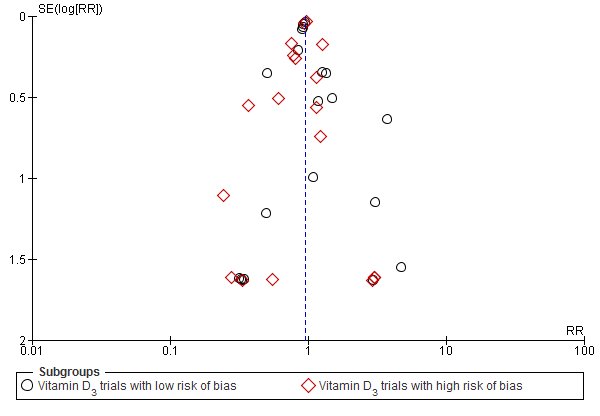
Figure w8: Funnel plot of comparison: 1 Vitamin D versus placebo or no intervention. Outcome: 1.7 All-cause mortality in trials using vitamin D3 (cholecalciferol)) according to risk of bias.
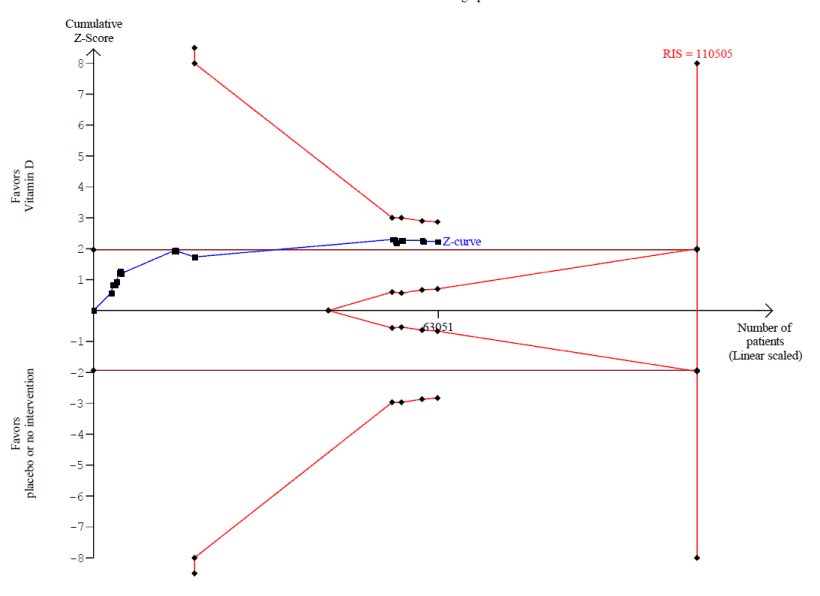
Figure w9: Trial sequential analysis on mortality in the 27 trials that administered vitamin D3 combined with calcium. The diversity-adjusted required information size (RIS) was calculated based on a mortality in the control group of 10%; a relative risk reduction of 5% in the experimental group; a type I error of 5%; and type II error of 20% (80% power). There was no diversity. The required information size was 110,505 participants. The cumulative Z-curve (blue line) did not cross the trial sequential monitoring boundary for benefit (red inward sloping line) at any time. Accordingly, the crossing of the conventional statistical 5% boundary (the horizontal brown line) may be due to random errors.
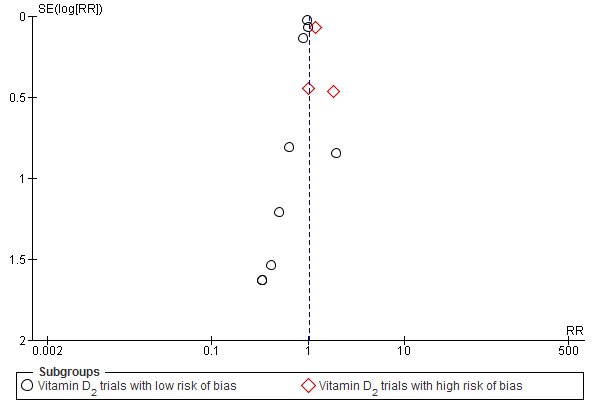
Figure w10: Funnel plot of comparison: 1 Vitamin D versus placebo or no intervention. Outcome: 1.13 All-cause mortality in trials using vitamin D2 (ergocalciferol).
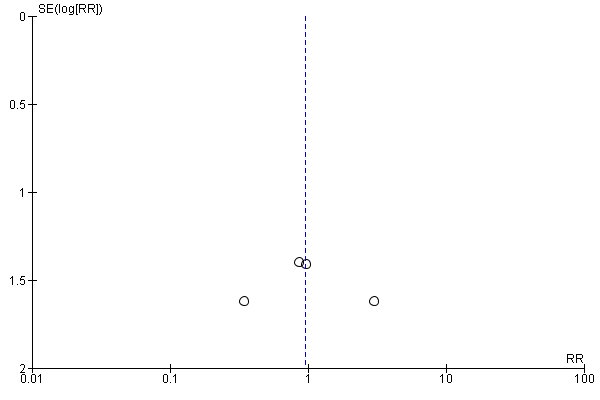
Figure w11 (Analysis 1.18): Funnel plot of comparison: 1 Vitamin D versus placebo or no intervention. Outcome: 1.18 All-cause mortality in trials using alfacalcidol (1-α hydroxyvitamin D).
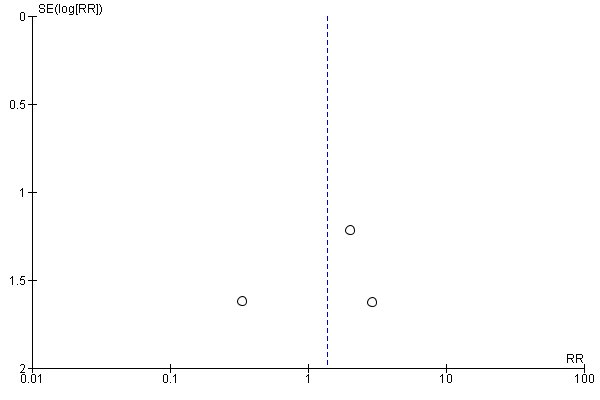
Figure w12 (Analysis 1.20): Funnel plot of comparison: 1 Vitamin D versus placebo or no intervention. Outcome: 1.20 All-cause mortality in trials using calcitriol (1,25-dihydroxyvitamin D).
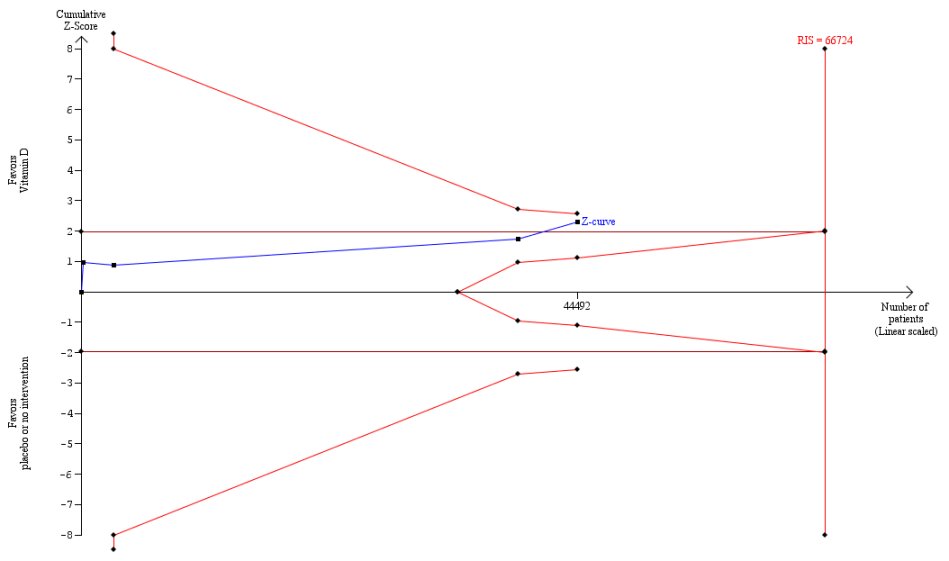
Figure w13: Trial sequential analysis on cancer mortality in the four trials that administered vitamin D3. The diversity-adjusted required information size (RIS) was calculated based on a mortality in the control group of 2.85%; a relative risk reduction of 12.28% in the experimental group; a type I error of 5%; and type II error of 20% (80% power). There was no diversity. The required information size was 66,724 participants. The cumulative Z-curve (blue line) did not cross the trial sequential monitoring boundary for benefit (red inward sloping line). Accordingly, the crossing of the conventional statistical 5% boundary (the horizontal brown line) may be due to random errors.
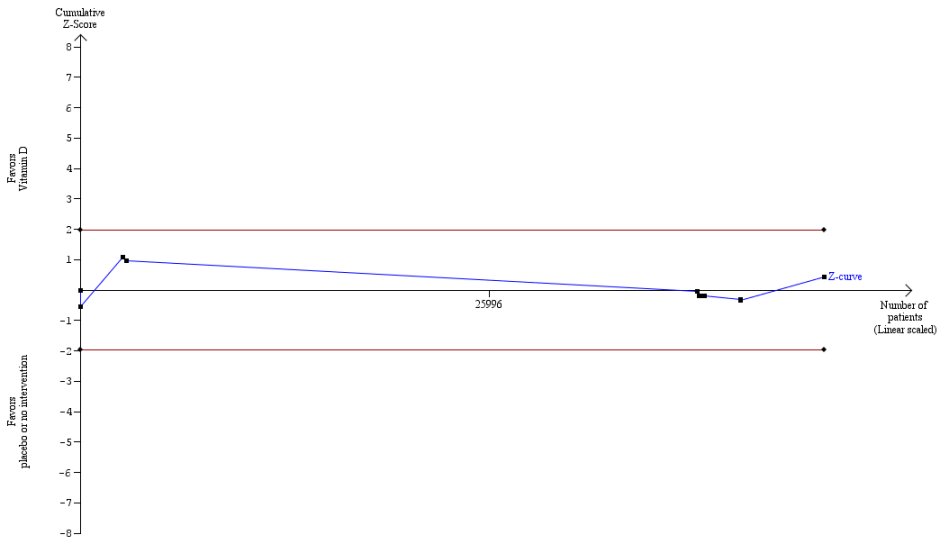
Figure w14: Trial sequential analysis on cardiovascular mortality in the 10 trials that administered vitamin D3. The diversity-adjusted required information size (RIS) was calculated based on a mortality in the control group of 4.17%; a relative risk reduction (low bias based) of 1.68% in the experimental group; a type I error of 5%; and type II error of 20% (80% power). There was no diversity. The required information size was 2,539,845 participants (not shown). The cumulative Z-curve (blue line) did not cross the conventional monitoring boundary for benefit (red line) after the tenth trial, neither did it reach the trial sequential monitoring boundaries for futility (not shown).